
What does IFLY VERDE™ measure?
Using biophysical parameter methodology, IFLY VERDE™ currently measures the following three parameters: 1. fCover (Fraction Green Vegetation Cover index), 2. LAI (Leaf Area Index) and 3. CHL (Chlorophyll).
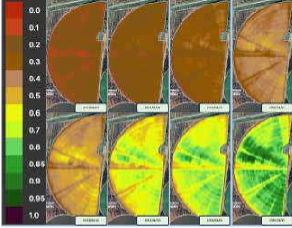
- fCover – Figure 1
- The % of plant material that covers the soil
- Provides an early-season indication of the rate of crop development and
- Minimum of 3 images a In the example provided, 8 images can be seen.
- LAI – Figure 2
- The ratio of green leaves present per unit ground area (m2 : m2).
- Characterises the plant-canopy structure and gives an idea of the amount of biomass available in a Measures crop growth and productivity.
- Fields should ideally exhibit uniformity throughout the season, but variations may arise due to soil irregularities, pests, diseases, or weed presence.
80 µg/cm2.
- Chlorophyll A/B variations indicate ageing, stress, or damage to the photosynthetic apparatus, reflecting both biotic and abiotic factors like drought, sunlight exposure and pigment-inhibiting diseases that could impact crop
- There is a strong correlation between chlorophyll content and nitrogen
3. CHL – Figure 3
- Chlorophyll A & B content per unit of
- Values typically range between 20 and 80 µg/cm2.
- Chlorophyll A/B variations indicate ageing, stress, or damage to the photosynthetic apparatus, reflecting both biotic and abiotic factors like drought, sunlight exposure and pigment-inhibiting diseases that could impact crop
- There is a strong correlation between chlorophyll content and nitrogen
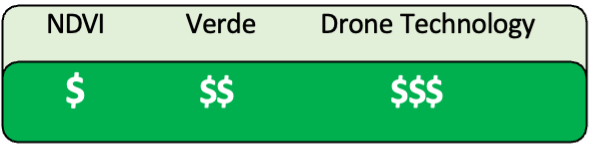
IFLY VERDE™ offers a relatively inexpensive, yet more advanced than NDVI, remote sensing technology (drone technology) for measuring vegetation biomass and more.
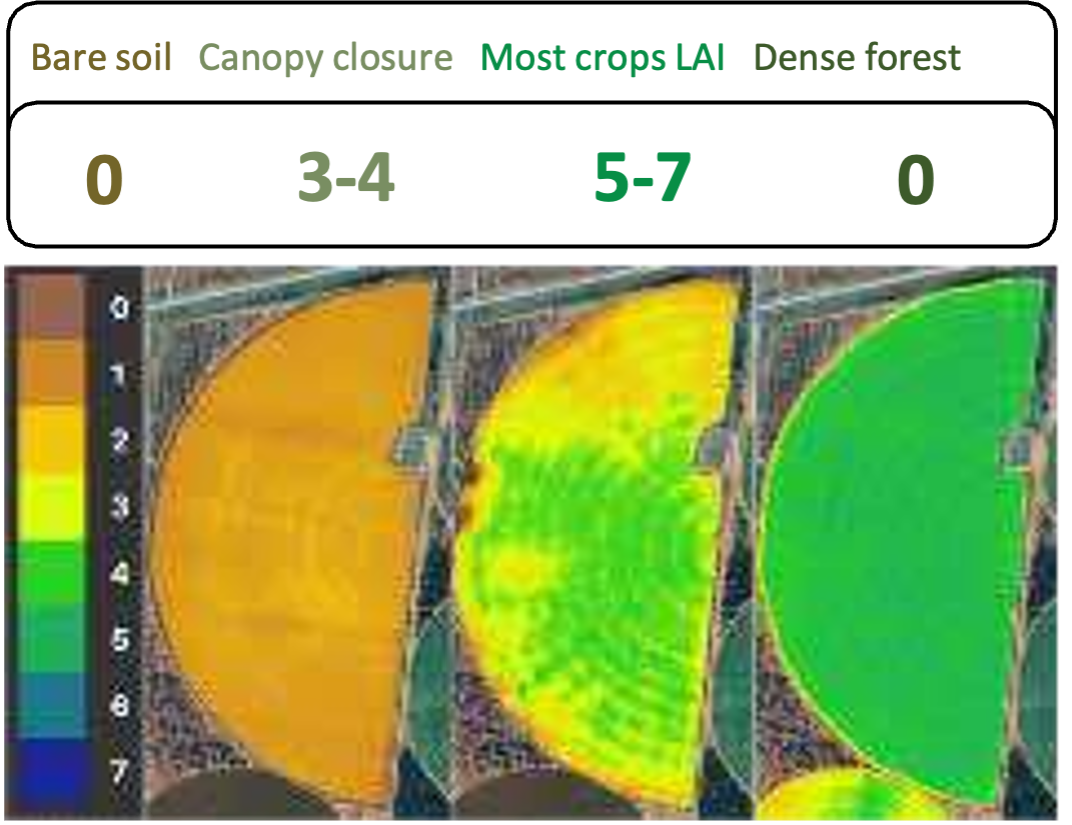
Figure 2: An example of LAI imagery.
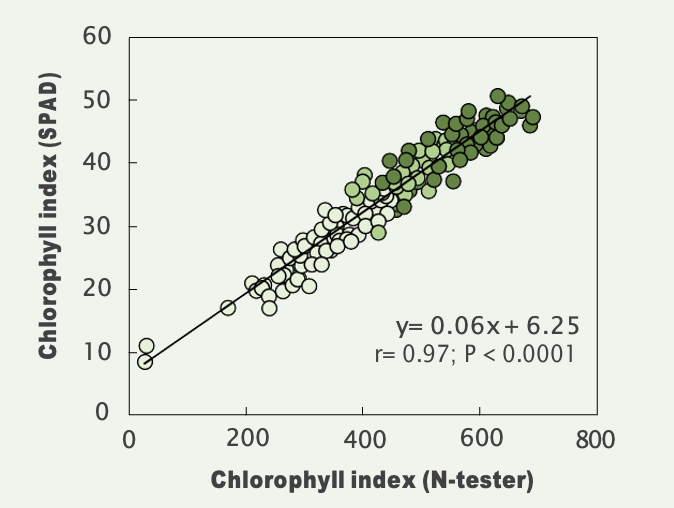
Figure 3: Correlation between chlorophyll and nitrogen indicated on a graph.
Thibaut Verdenal, Vivian Zufferey, Jean-Sébastien Reynard, Jean-Laurent Spring (2023).
In conclusion
As the journey through fCover, LAI and CHL brings an understanding of the benefits of each, envision the power these indices bring to producers’ fingertips – a dynamic story told through each leaf and every shade of green.
In the evolving narrative of agriculture, these indices stand as protagonists, guiding producers toward informed decisions and promising a future where technology and nature combine for a flourishing harvest.